FDV & Episcenter – CS & CX Measurement in Smart Cities
Measuring CS & CX in Smart Cities through EpisXperience Platform
In collaboration with the Faculty of Social Science, we created a comprehensive model for measuring CS & CX in Smart Cities.
-
ClientsUniversity of Ljubljana, Faculty of Social Sciences
-
IndustrySmart Cities
-
Years2022-2023
THE CHALLENGE
Building a Bridge Between Citizens and City Administration
Our collaboration focuses on gathering and analyzing survey data to shape a brighter future. The department’s students, experts in survey methodology, analytics, and sociology, developed an innovative model that enables cities to engage directly with residents, using their feedback to drive sustainable city development that puts people first.
OUR SOLUTION
The Prototype System
Thanks to EpisXperience platform, we’ve built a prototype system that allows city administrations to keep a close eye on satisfaction among its citizens and gain insights into their city’s dynamics using data from various sources.

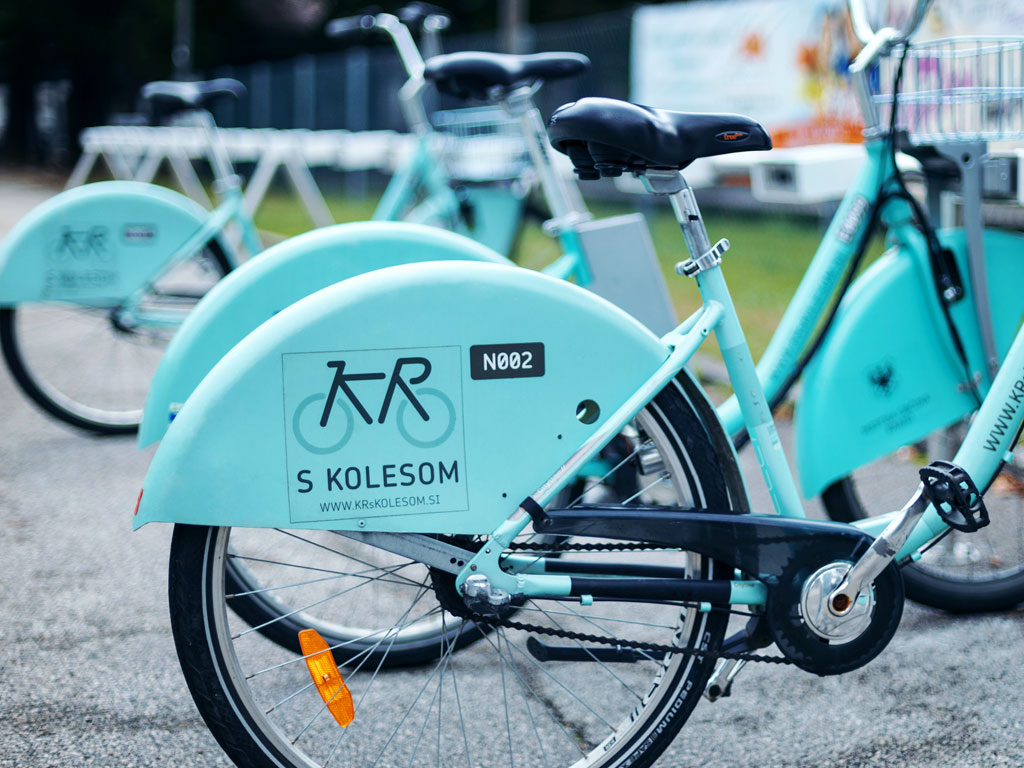
Identifying Touchpoints
Every city has a wealth of potential touchpoints through which city administration can engage with its citizens. These include civil services, educational institutions, cultural and sports organizations, health institutions, public transport, service industries, tourism, and more. Each of these points presents an opportunity for the city administration to establish connections and interact with its residents.
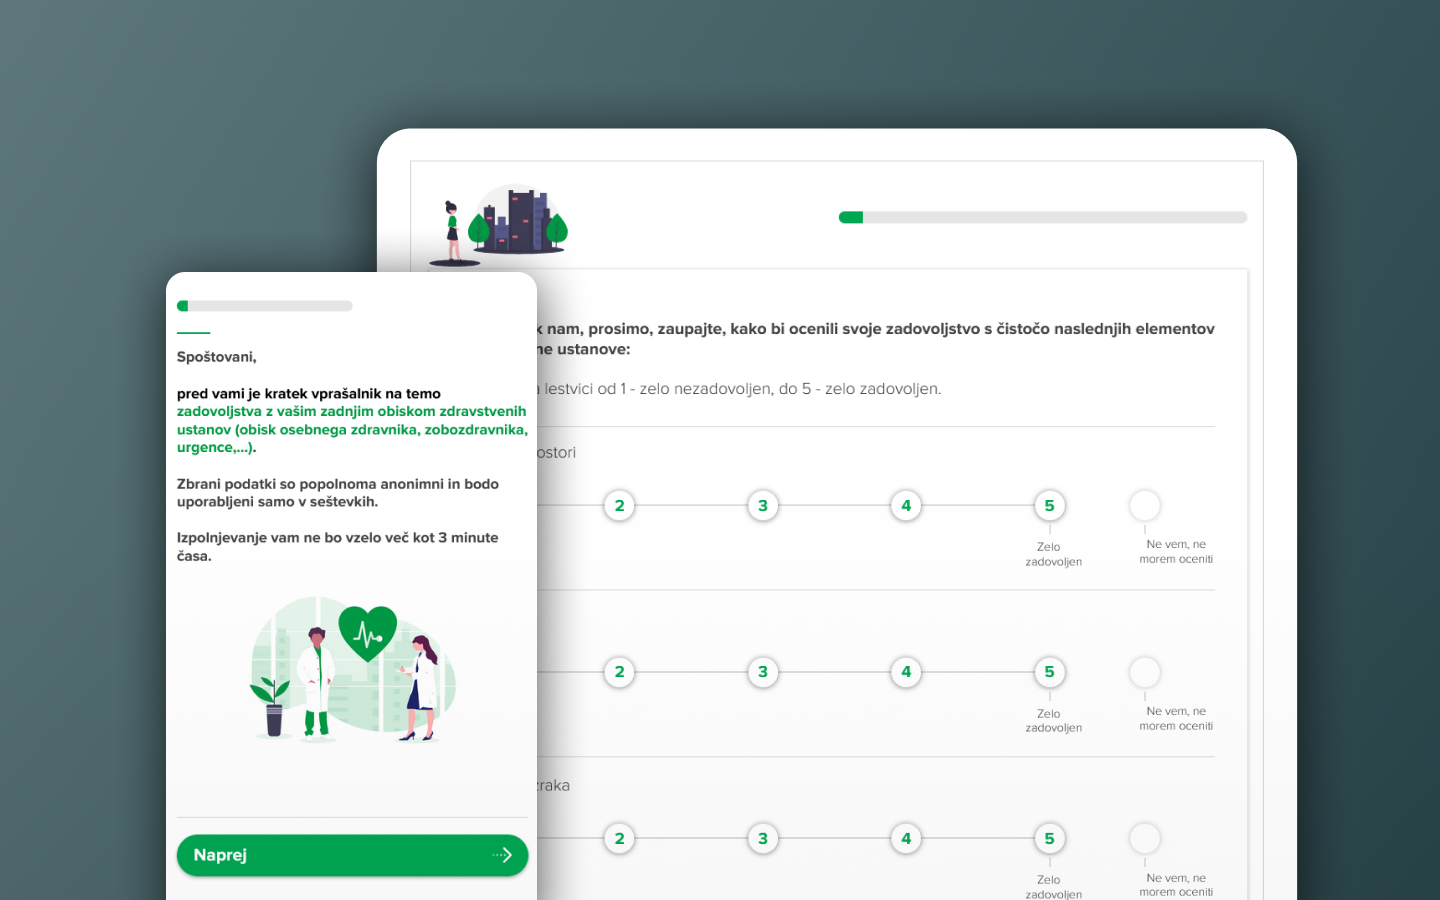
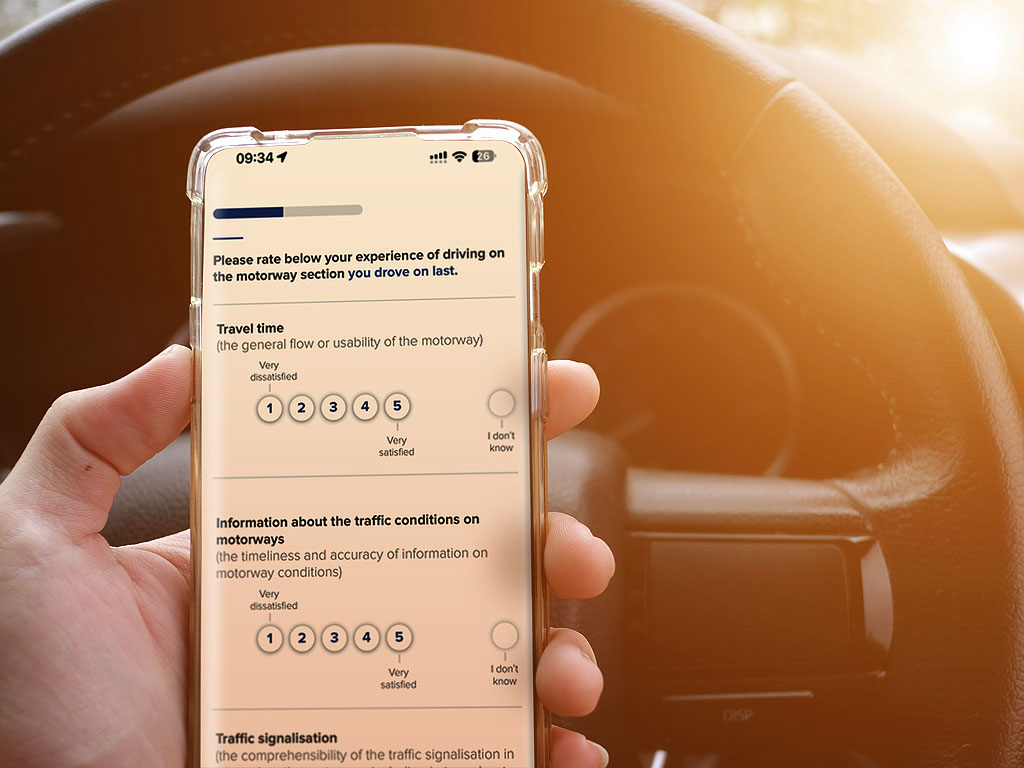
Designing Measuring Tools
The methodological team developed a comprehensive library of survey questions that can be applied to all contact points within the city. These serve as a baseline for KPIs, such as the general satisfaction index. These questions assess various dimensions, including general satisfaction, cleanliness, professionalism, safety and security, trust, accessibility, and more. This library provides a valuable resource for measuring and evaluating these important aspects across different areas of the city.
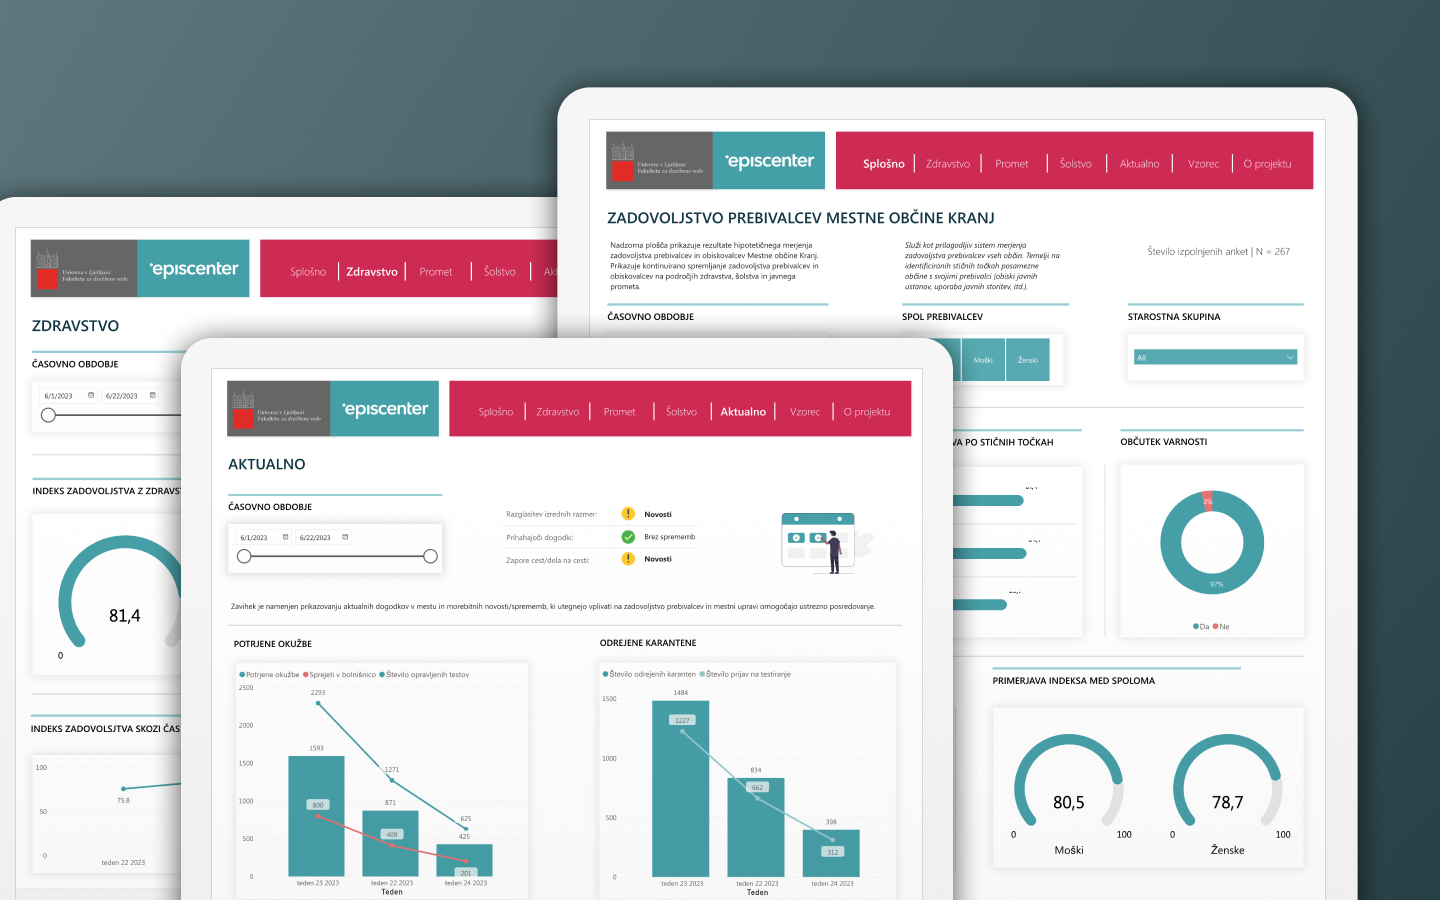
Creating an Interactive Dashboard for City Administrations
By integrating survey data with additional data sources like data about road closures, accidents, and states of emergencies, the analytical team has developed a prototype dashboard. This dashboard offers valuable insights into the fluctuations of KPIs and changes in levels of citizen satisfaction. It also provides potential explanations for these fluctuations.
THE RESULTS
An Integrated Smart City Solution for Quick Decision-Making
This solution allows for quick decision-making, particularly in ensuring the public health and safety of citizens. This integrated approach empowers city administrators to make informed decisions and take proactive measures to address issues promptly, put people first and make steps in sustainable development.
RELATED WARP IT PLATFORM PACKAGES
RELATED SERVICES
HOW CAN WE HELP?
CONTACT OUR CONSULTANT